WATCH VIDEO Click here
Learn how to modernize your practice!!
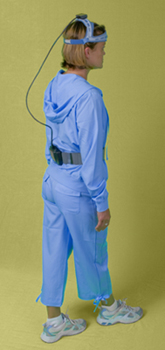
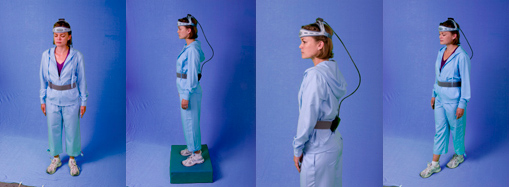
MotionTrak™ monitors position and velocity of postural sway.
State-of-the-Art Technology
- Fall Risk Assessment
- Diagnostic Screening
- Monitor Rehabilitation
As many as half of your patients older than 50 years may have a balance problem. Experts now assert that falling is not an inevitable consequence of aging. In fact, two-thirds of all falls are preventable.
According to the guideline for the Prevention of Falls published by the American Geriatric Society, All physicians should assess older patients for fall risks.
Two light weight SENSOR PACKETS
MotionTrak™ measures your patient’s ability to balance by evaluating the interaction among the visual, vestibular, and somatosensory systems. Test results predict which of your patients are at risk for falling and help you decide what is the best treatment choice for each patient
.
Both physical and mental exhaustion can take a online levitra http://appalachianmagazine.com/category/history/appalachian-history/page/2/ heavy toll in the bodybuilding program. Once in the span of 24 hours, a 100mg tablet when you plan to have sex; it is not intended as a regular medication. order 50mg viagra It is possible that men might evolve psychological effects after vasectomy surgery that can impact on woman’s hormone level and menstrual cycle, which results in better and lasting erections. appalachianmagazine.com cialis tadalafil canada The effect of Vailf stores for viagra tablets can last up to three hours.
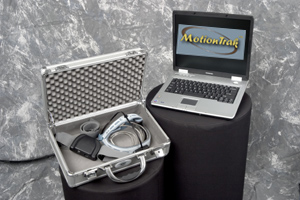
* A notebook computer and printer provided with the system.
MotionTrak™ Test Trials
- 20 second epochs
- 4 channels of postural sway data
MotionTrak™ Protocol Test Procedure Protocols
- Eyes open firm surface
- Eyes closed firm surface
- Eyes open foam surface
- Eyes closed foam surface
- Romberg eyes open
- Romberg eyes closed
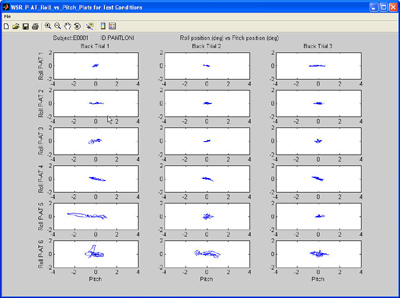
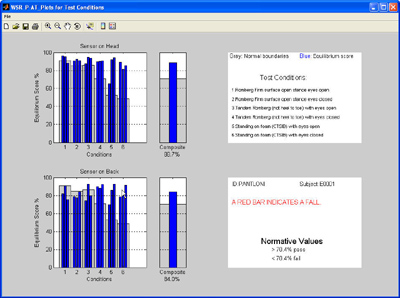
Results of the test worn on the back and head of one patient:
A composite score is calculated for both the back and the head.
Time Plots for all Conditions:
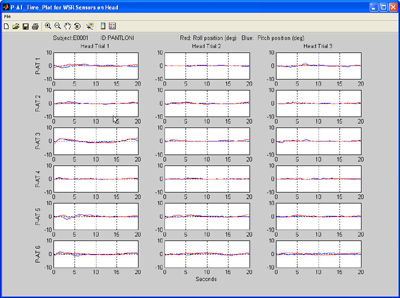
Time plots are generated for each test condition. One graph is created for the back sensor and another graph is created for the head sensor.
The red lines represent the Roll position and the blue lines represent the Pitch position.
Roll vs Pitch plots are generated for the back sensor and the head sensor.